 At Hanukkah (coming up in December) Jewish children play a
game for pennies with the four sided spinning top shown here. When
it's your turn you spin the top. This is what happens:
At Hanukkah (coming up in December) Jewish children play a
game for pennies with the four sided spinning top shown here. When
it's your turn you spin the top. This is what happens:
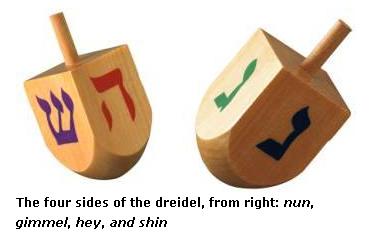
  letter showing  result
     gimmel       take all the pennies in the pot
     hey          take half the pennies in the pot
     shin         put one penny in the pot
     nun          nothing (next player's turn)
- What is the probability that a gimmel appears?
- What is the probability that the person spinning the dreidel wins something on her turn?
- What is the probability that the person spinning the dreidel loses a penny twice in a row?
- Suppose there are ten pennies in the pot when you spin. What would be the "fair price" to play? That is, on the average, how much would you expect to win?
- (Extra credit) Why do you think the picture caption describes the four sides of the dreidel from right to left?
The picture is from the web site www.myjewishlearning.com/holidays/Hanukkah/TO_Hanukkah_Home/Dreidel/Dreidel_Rules_357.htm#, where you can read more if you like. But you won't find anything else there to help with this question.
WHL has received 10 million shares of CAJT stock ... WHL has paid an advertising cost of nine hundred ninety thousand dollars to produce and distribute this public awareness mailer.
- Suppose CAJT stock is selling at $0.41/share. How much profit will WHL make if they sell their shares now?
- What is likely to happen to the stock price when WHL sells its 10 million shares and walks away with the profits?
- Estimate how many copies of the flyer WHL sent out. (Hint: you know how much they say they spent on production and distribution.)
- (Extra Credit) WHL believes that the price of CAJT stock will rise significantly if at least 5,000 people buy some when they get the mailer. Use your answer to the previous problem to determine what percentage of the people receiving the mailing must respond in order for this to happen.
- (Extra Credit) WHL hopes their mailer will succeed in encouraging people to buy CAJT, so the price will go up. How much extra profit will they make for each penny increase in the stock price?
                    year
    age range    2000   2050
       0-9      39.70   55.60
     10-19      40.86   53.56
     20-29      39.90   52.89
     30-39      43.24   52.85
     40-49      42.77   49.98
     50-59      31.35   46.26
     60-69      20.40   42.83
     70-79      16.28   32.57
     80+         9.25   33.70
You can download that table directly into Excel from the link
USPopulationProjection.xls.
Answer the following questions. (Excel will help, of course!) Write the answers in your blue book (except for the chart).
Turn in a printout of your entire spreadsheet (not just the chart) and also send the spreadsheet as an email attachment to yourself and to eb@cs.umb.edu. Make sure the data are not hidden by the chart.
- What was the total population of the United States in 2000? What is the projected value for 2050?
- Verify the result of your year 2000 calculation by finding the same number on a reliable web site. Do the numbers match exactly?
- What are the absolute and percentage increases in the U.S. population between 2000 and the projected value for 2050?
- Which age range shows the smallest percentage increase between 2000 and 2050? What are the absolute and percentage increases in that age range?
- Which age range shows the largest percentage increase between 2000 and 2050? What are the absolute and percentage increases in that age range?
- Construct and properly label a column chart displaying the information in the table.
- (Extra credit) Estimate the mean and median ages for each of the years 2000 and 2050. Describe how you did the work.
   Newspaper			circulation	change
   ---------                    -----------     ------
   USA Today			2,293,137	up 1.04%
  The Wall Street Journal	2,011,882	down 1.53%
  The New York Times		1,037,828	down 4.51%
  Los Angeles Times		779,682		up 0.50%
  New York Daily News		681,415		down 1.73%
  New York Post  		667,119		down 5.24%
  The Washington Post		635,087		down 3.23%
  Chicago Tribune		559,404		down 2.90%
  Houston Chronicle		507,437		down 0.13%
  Newsday, Long Island		387,503		down 5.62%
  The Arizona Republic		382,414		down 3.75%
  The Dallas Morning News	373,586		down 7.68%
  San Francisco Chronicle	365,234		down 2.29%
  The Boston Globe		360,695		down 6.66%
  The Star-Ledger (Newark, NJ)	353,003		down 2.78%
  The Philadelphia Inquirer	338,260		up 2.31%
  Star Tribune (Minneapolis)	335,443		down 6.53%
  The Plain Dealer (Cleveland)	334,195		down 0.81%
  Detroit Free Press		320,125		down 2.61%
  Atlanta Journal-Constitution	318,350		down 9.08%
We've downloaded them to Excel and put them in spreadsheet NewspaperCirculation.xls.
- What was the mean circulation for these newspapers?
- What was the median circulation for these newspapers?
- Why are the mean and the median so different?
- If asked to report the mode for these circulation figures, what would you say?
Heres the link to the complete article: www.boston.com/business/globe/articles/2007/11/06/newspaper_circulation_still_on_decline/. There's nothing there that will help you with the questions on this exam.