Chimera Performance Dashboard
Project Overview
This project focuses on collecting and displaying data from UMass Boston's systems in a way that is clear and user-friendly. Specifically we will focus on displaying data from two components.- Babbage - A machine on the CS Department's server that has an NVIDIA RTX 4080 GPU. Anyone can SSH into it and use it directly. We initially planned to test our software stack on Babbage before pivoting to Chimera directly.
- Chimera - A GPU cluster made up of 32 GPUs (Nvidia H200s), 224 CPU cores, and 2TB of RAM. This system is what we ultimately want to extract data from and build a dashboard for.
Metrics
This section will show important system and GPU metrics such as CPU usage, memory usage, GPU utilization, temperature, and power consumption.Documentation
Our task is to collect performance metrics from servers on the UMass Boston CS cluster and visually displays them on a dashboard website. The project uses two main tools:
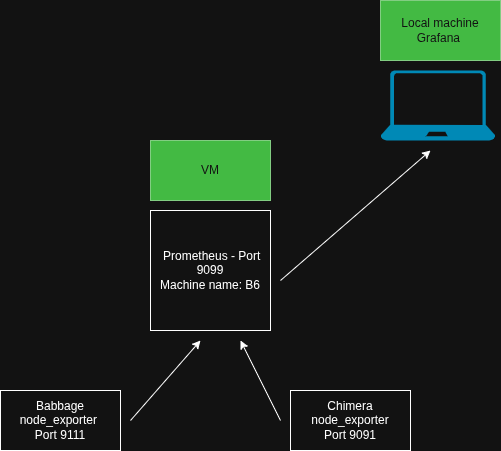
- Prometheus - software that reads data metrics from a server and stores them in a database.
- Grafana - software that displays the data stored by Prometheus as visual charts and graphs.
In order for Prometheus to collect data, a node exporter must be deployed on each server. A node exporter is the program that takes live readings from the system - CPU usage, memory, system load, and more. Prometheus reads from the node exporter in timed intervals and stores the results in a database, building a history of the system's performance over time.
March 31, 2026
So far, we have accomplished 4 main tasks:
- Set up virtual machine (b6) on CS server - The VM runs Ubuntu on the CS server. All group members have access by SSHing into the machine.
- Run node exporter on b6 - node_exporter is a tool that reads metrics from the system (memory, cpu usage, etc.). We started it on our VM confirming that it was running and exposing metrics.
- Prometheus data collection - Prometheus is successfully scraping data from the node exporter and storing it.
- Grafana display - Grafana is connected to Prometheus and correctly displaying the collected metrics.
April 14, 2026
- Readings on the dashboard - Grafana dashboard is gathering the data from the CPU, and we're successfully gathering the metrics on the dashboard.
- Services for both Prometheus and node_exporter are running.
- Both services running on VM provided by Tom.
April 17, 2026
We attempted to set up the DCGM exporter on Babbage. The DCGM exporter is a tool made by NVIDIA to expose metrics on their GPUs. Babbage is the GPU owned by the CS department. We were unsuccessful in installing the DCGM exporter because the version of Go on Babbage was too old, and the owners of the GPU did not want any changes made to the system.
SolutionWe were provided the DCGM exporter on chimera21 and the cpu node_exporter was downloaded on Chimera's head node. Therefore, we pivoted to running software to adapt directly for Chimera.
Blake, Stephanie, Desmond, Dhruv, Aihemaiti